Blog

Key takeaways:
Ask five agencies what a web application costs and you will get five ranges that barely overlap. One guide puts a mid-complexity build at $25,000 to $45,000; another puts it at $100,000 to $250,000. Both are honest, and neither is useful on its own.
The reason is that a band is a label, not an estimate. The tiers are defined differently by every publisher, so "medium complexity" means a customer portal in one guide and a real-time collaboration app in another.
Web application development cost estimation only becomes possible once the scope behind the label is written down. The number follows the scope, and the scope is the part nobody puts in the proposal.
This guide is about the scope questions specific to a web application, the ones that move a quote and get left out of the conversation. The general labor math behind any software build, the rate question and a cost calculator all live in our breakdown of software development costs, and none of it is repeated here.
Here is what the published guidance actually says, with each band credited to the firm that published it and every page read in October 2026. Every one of these is the publisher's own figure, based on its own work, and none is independently sourced. Published ranges move without notice, so treat the table as a dated snapshot rather than a current price list.
| Source | Simple | Mid | Complex or enterprise |
|---|---|---|---|
| Monterail | $15,000 to $25,000 | $25,000 to $45,000 | $50,000 to $150,000, enterprise above |
| SaM Solutions | $20,000 to $70,000 | $80,000 to $180,000 | $200,000 to $500,000+ |
| MindK | $20,000 to $50,000 | $100,000 to $250,000 | not stated |
| MindInventory | $12,000 to $15,000 | $30,000 to $50,000+ | $50,000+ |
| Bacancy | $10,000 to $30,000 | $30,000 to $150,000 | $150,000 to $500,000+ |
| Couchbase | $10,000 to $40,000 | $50,000 to $250,000 | $250,000 to $1,000,000+ |
Read the mid column on its own. It starts at $25,000 and ends at $250,000, which is a tenfold spread for a tier every publisher calls the same thing.
Laid on one axis, the six bands barely share a region.
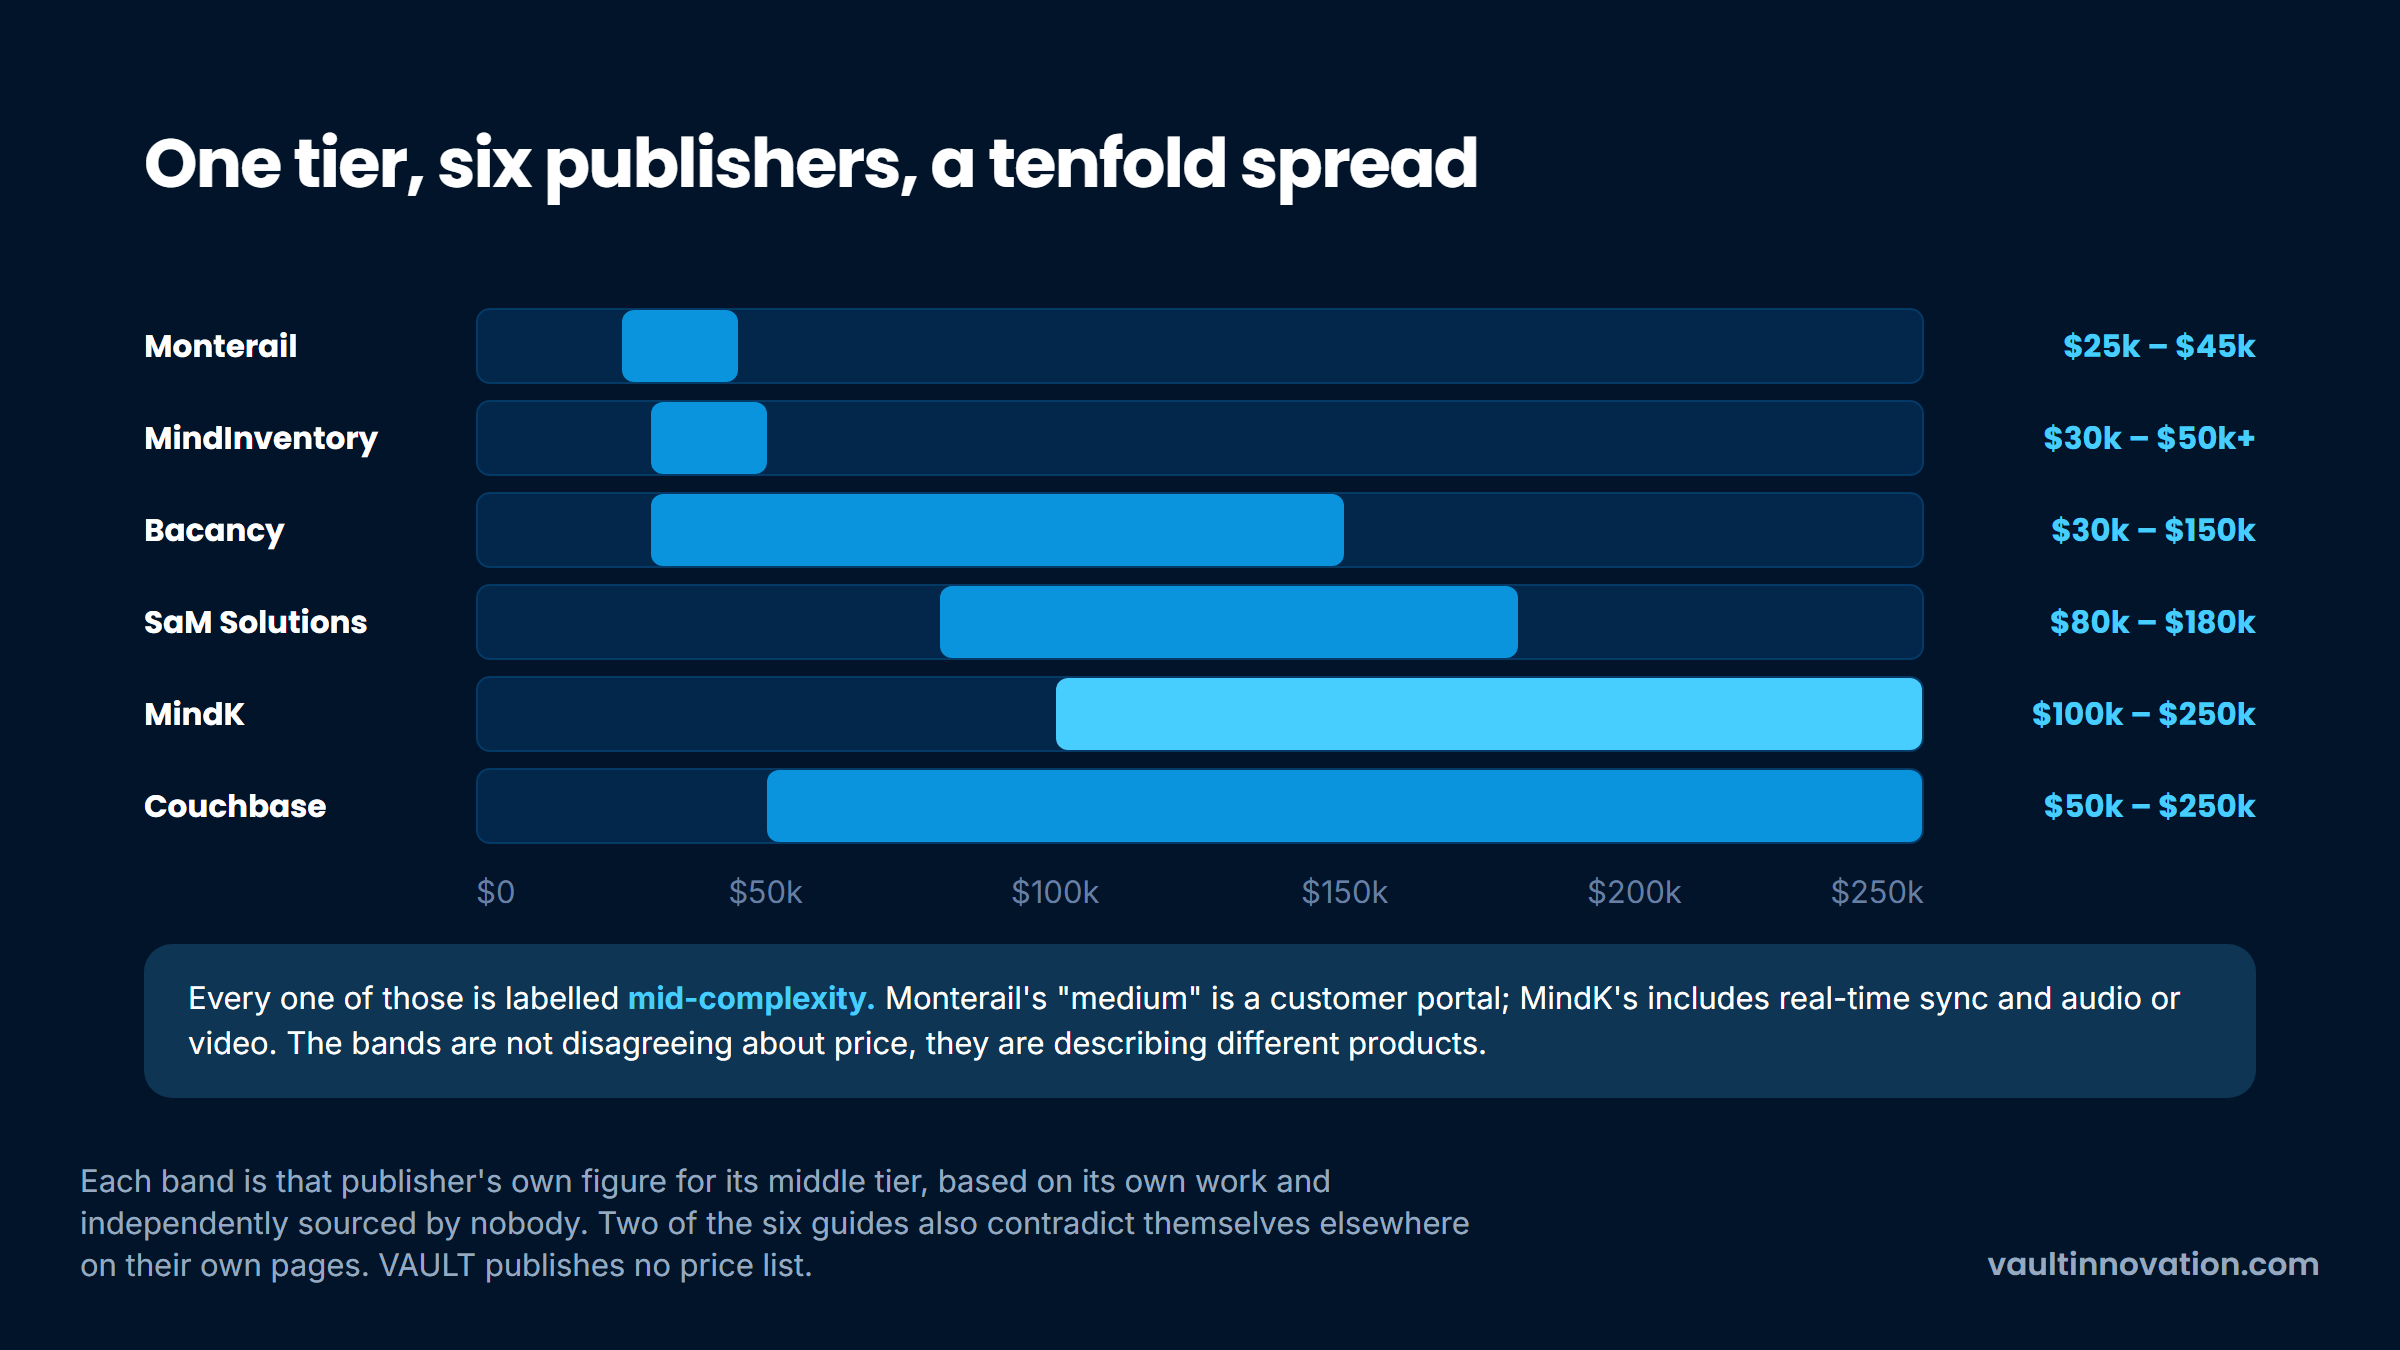
The spread is not disagreement about price. It is disagreement about what the word covers. Monterail's "medium" is a customer portal; MindK's "mid-complexity" includes real-time sync and audio or video. Those are different products wearing the same label, and once you see that, the ranges stop conflicting and start being uninformative.
Two of these guides also contradict themselves. One puts simple builds at $20,000 to $70,000 in its headline table and $10,000 to $60,000 in its own FAQ. Another publishes a complex band of $100,000 to $400,000 that overlaps its own medium band of $50,000 to $250,000.
So the useful move is not to collect more ranges. It is to work out which questions change the answer, and ask those before anyone quotes you.
Almost every cost guide lists "platform compatibility" as a bullet and moves on. Nobody says how many browsers and screen sizes a quote assumes, which means nobody can tell you what changes when you add one.
The matrix is a real cost because each combination is another round of testing and another set of fixes. It is also not optional in the way teams assume. Statcounter's United States figures for September 2026 put Chrome at 53.82 percent and Safari at 30.42 percent, with Edge at 7.51 and Firefox at 3.33.
Nearly a third of US traffic on Safari means "we tested in Chrome" is not a position you can hold. The device split says the same thing from another angle: mobile 49.1 percent, desktop 48.47 percent, tablet 2.42.
Half your users arriving on a phone is a testing cost whether or not you ever build a native mobile app, and it is the most common reason a quote that looked complete grows a second round of fixes.
Two of the four browsers account for most of what you have to test against.

So ask for the matrix in writing before you compare two quotes. A proposal that covers current Chrome, Safari, Edge and Firefox on desktop plus iOS Safari and Android Chrome is quoting a different job from one that says "modern browsers," and the second one will find that out during your user acceptance testing rather than its own.
Responsive design gets quoted as a property of the build. In practice each breakpoint is a set of layouts somebody has to design, review and test.
A quote that assumes two breakpoints and a quote that assumes four are pricing different amounts of design work, and the difference compounds: every new state, empty view and error message exists at each width. The one published figure here puts a UI and UX process at $7,000 to $10,000, from MindInventory, and tellingly does not tie that to a breakpoint count at all.
The practical question to ask is how many layouts the design covers and whether tables and data-dense screens are included at the smallest width. Tables are where responsive work gets expensive, because a dashboard that works at 1,400 pixels has to become something else entirely at 390.
At VAULT this is the line item we most often find missing from a proposal we are asked to review. Any development estimate worth comparing should name the breakpoint count, because two quotes assuming different numbers are not pricing the same work.
Authentication gets priced. Authorization usually does not, and it is the bigger number.
Each additional role multiplies the surface area of the product: more screens, more states per screen, more test cases, and more ways for the wrong person to see the wrong record. A product with an admin and a standard user is not half the work of one with five roles, because permission logic interacts with everything else.
The published figures treat this as a feature rather than a multiplier. Bacancy prices basic authentication at $3,000 to $8,000, advanced at $8,000 to $25,000, and custom or multi-tenant at $15,000 to $60,000, with social login at $500 to $2,000. Those are its figures, not ours, and the fourfold jump between tiers is the signal worth reading.
We built Honest Game as a web application where the role structure was the product: students, parents and school administrators each needed a different view of the same eligibility data, with district-level dashboards on top. The scope conversation that matters on a build like that is not how login works, it is how many distinct answers the system has to give to the same question.
Ask any vendor to list the roles and, for each, what it can see, create, edit and delete. If that table does not exist before the estimate, the estimate is for a smaller product than the one you want.
Every guide prices integration setup. Bacancy's list is the most specific: payment gateways at $1,500 to $5,000 each, CRM at $2,000 to $8,000, and ERP or legacy integration at $10,000 to $40,000 and up.
What none of them prices is the second half, which is what happens afterward. A third-party API changes its version, tightens a rate limit, or goes down during your month end. Somebody has to notice, decide, and fix it, and whether that somebody is you or your vendor is a contract question that belongs in the estimate conversation.
Three questions settle it. Who monitors the integration, what the response time is when it fails, and whether a vendor-side breaking change is billable work or covered. Our own view on treating API design as a contract applies in both directions, and the integrations you consume deserve the same scrutiny as the ones you publish.
Of eleven cost guides read for this article, accessibility appears as a priced item in none of them. One mentions WCAG once, inside a list, and cites the superseded 2.1 version.
That is a real gap, because conformance is both a design constraint and a testing line. WCAG 2.2, published by the W3C in October 2023, added nine success criteria, six of them at Level A or AA, and four of those six land squarely on web application patterns rather than content pages.
Focus Not Obscured (2.4.11) governs sticky headers and cookie banners covering the element you just tabbed to. Dragging Movements (2.5.7) requires a non-drag alternative, which affects every kanban board and range slider. Target Size (2.5.8) sets a floor of 24 by 24 CSS pixels for interactive targets, which is where dense toolbars and table row actions fail. Accessible Authentication (3.3.8) restricts cognitive-function tests at login, which puts CAPTCHAs and password-paste blocking in scope.
Counted out, four of the nine land on things a web application actually has.
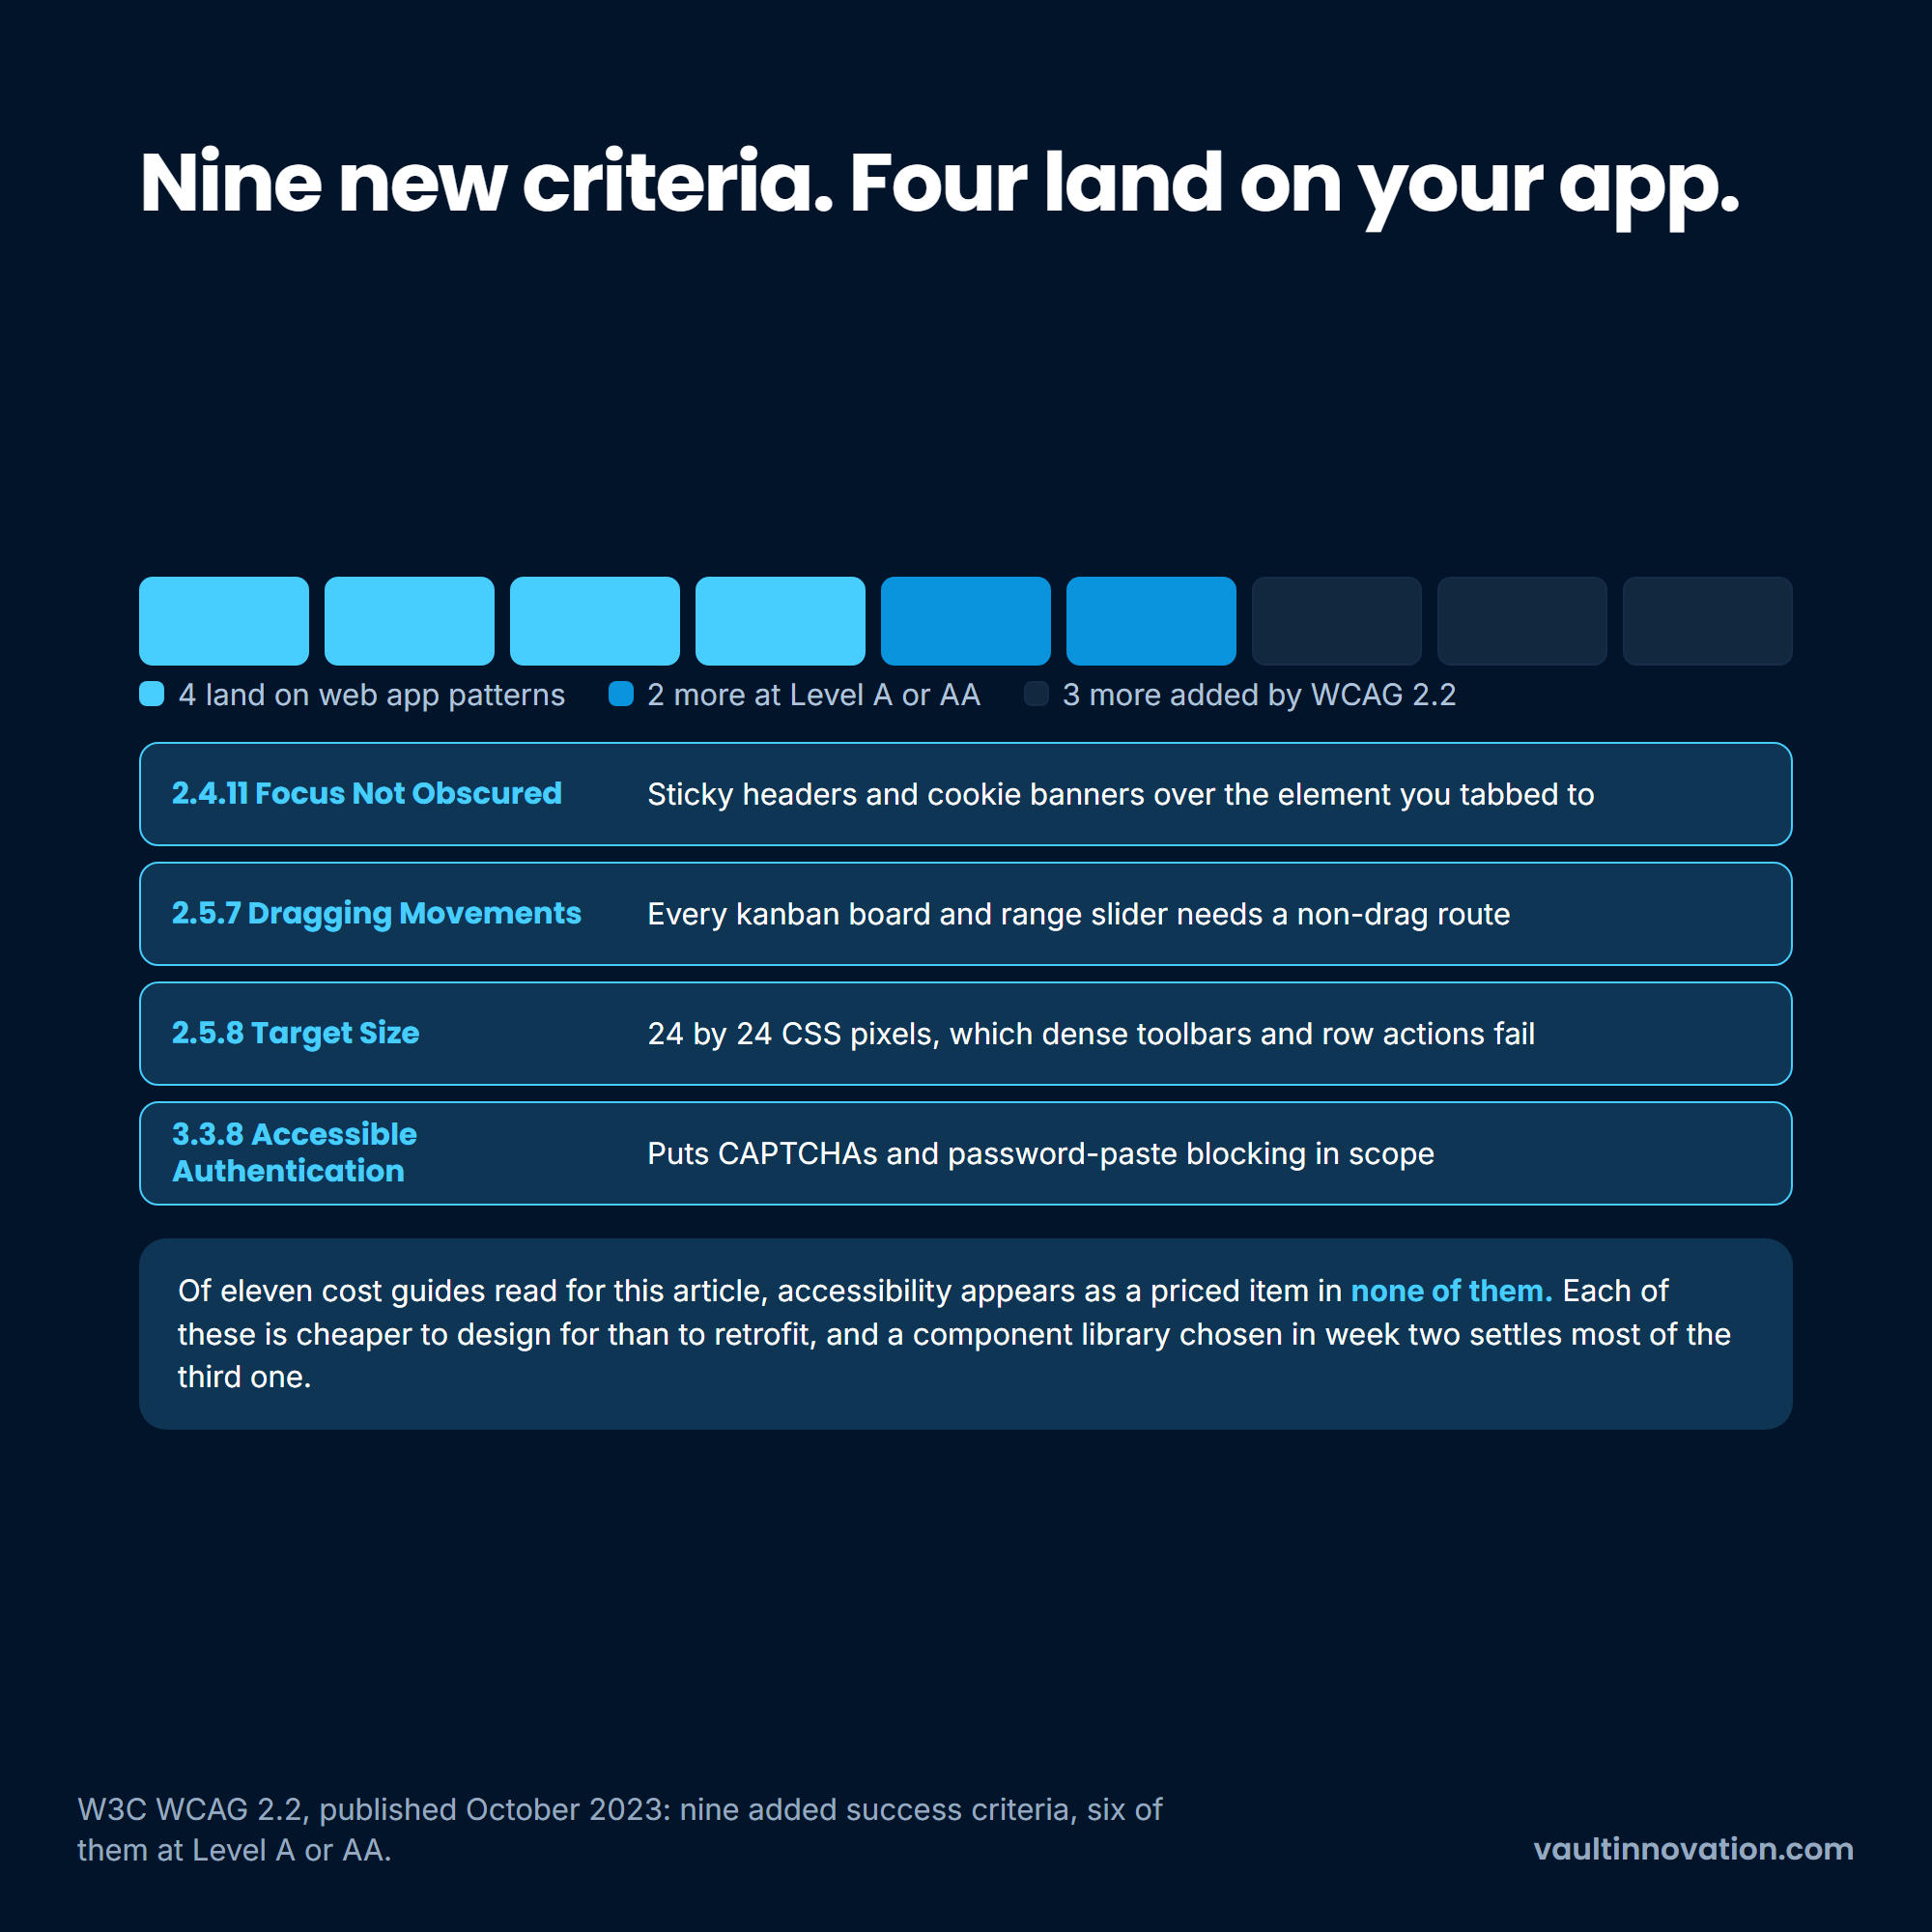
Each of those is cheaper to design for than to retrofit, which is the entire argument for naming it in the estimate. A component library chosen in week two decides most of your target-size outcomes.
If you sell to US state or local government, the question is not optional at all. The Department of Justice's ADA Title II rule sets WCAG 2.1 Level AA as the standard.
That is version 2.1, not 2.2, so the four criteria above are best practice for a commercial build rather than the legal floor. They are still worth pricing, because they are the ones that hit application UI hardest and cost more to retrofit than to design.
An interim final rule published in April 2026 moved the compliance dates, as of publication, to April 26, 2027 for entities serving populations of 50,000 or more, and April 26, 2028 for smaller entities and special district governments.
That rule binds public entities rather than private businesses. The honest framing for a commercial buyer is that a public-sector customer's procurement definition of accessible is now written down.
Moving your existing data in sounds like a one-week task and is usually the least predictable line in the estimate. The import is trivial. Deciding what the data means is not.
Developers on a Reddit thread pricing a small web app that ingests client spreadsheets made the point better than any vendor page. The reply that drew agreement was that storing data blindly is one thing, and storing it without introducing errors in the manipulation along the way is another, so validation and testing are where the hours go. That is anecdotal, and it matches what we see.
Another reply in the same thread asked the question that should have come first: how will the application get access to the client's database at all? Access arrangements, credentials and data-sharing approval are scoping work that happens before anyone writes code, and they routinely take longer than the migration script.
Two developers in that thread quoted roughly $4,000 to $7,000 and about $10,000 for the same described job. Even with a written brief, the quote moved by more than double, and the gap was entirely in how much validation each one assumed.
Run cost gets quoted as a monthly range, usually somewhere between $5 and $500, which tells you nothing. The number depends on architecture decisions, not on how many users you have.
Google publishes worked examples on its own Cloud Run pricing page that show this cleanly. Take ten million requests a month, 400 millisecond average latency, one vCPU and 512 MiB of memory. With twenty concurrent requests per instance, Google's estimate is $13.69 a month. Change one setting so each instance serves one request at a time, with everything else identical, and the same traffic costs $81.72.
Everything above the two bars is identical; only the setting on them differs.
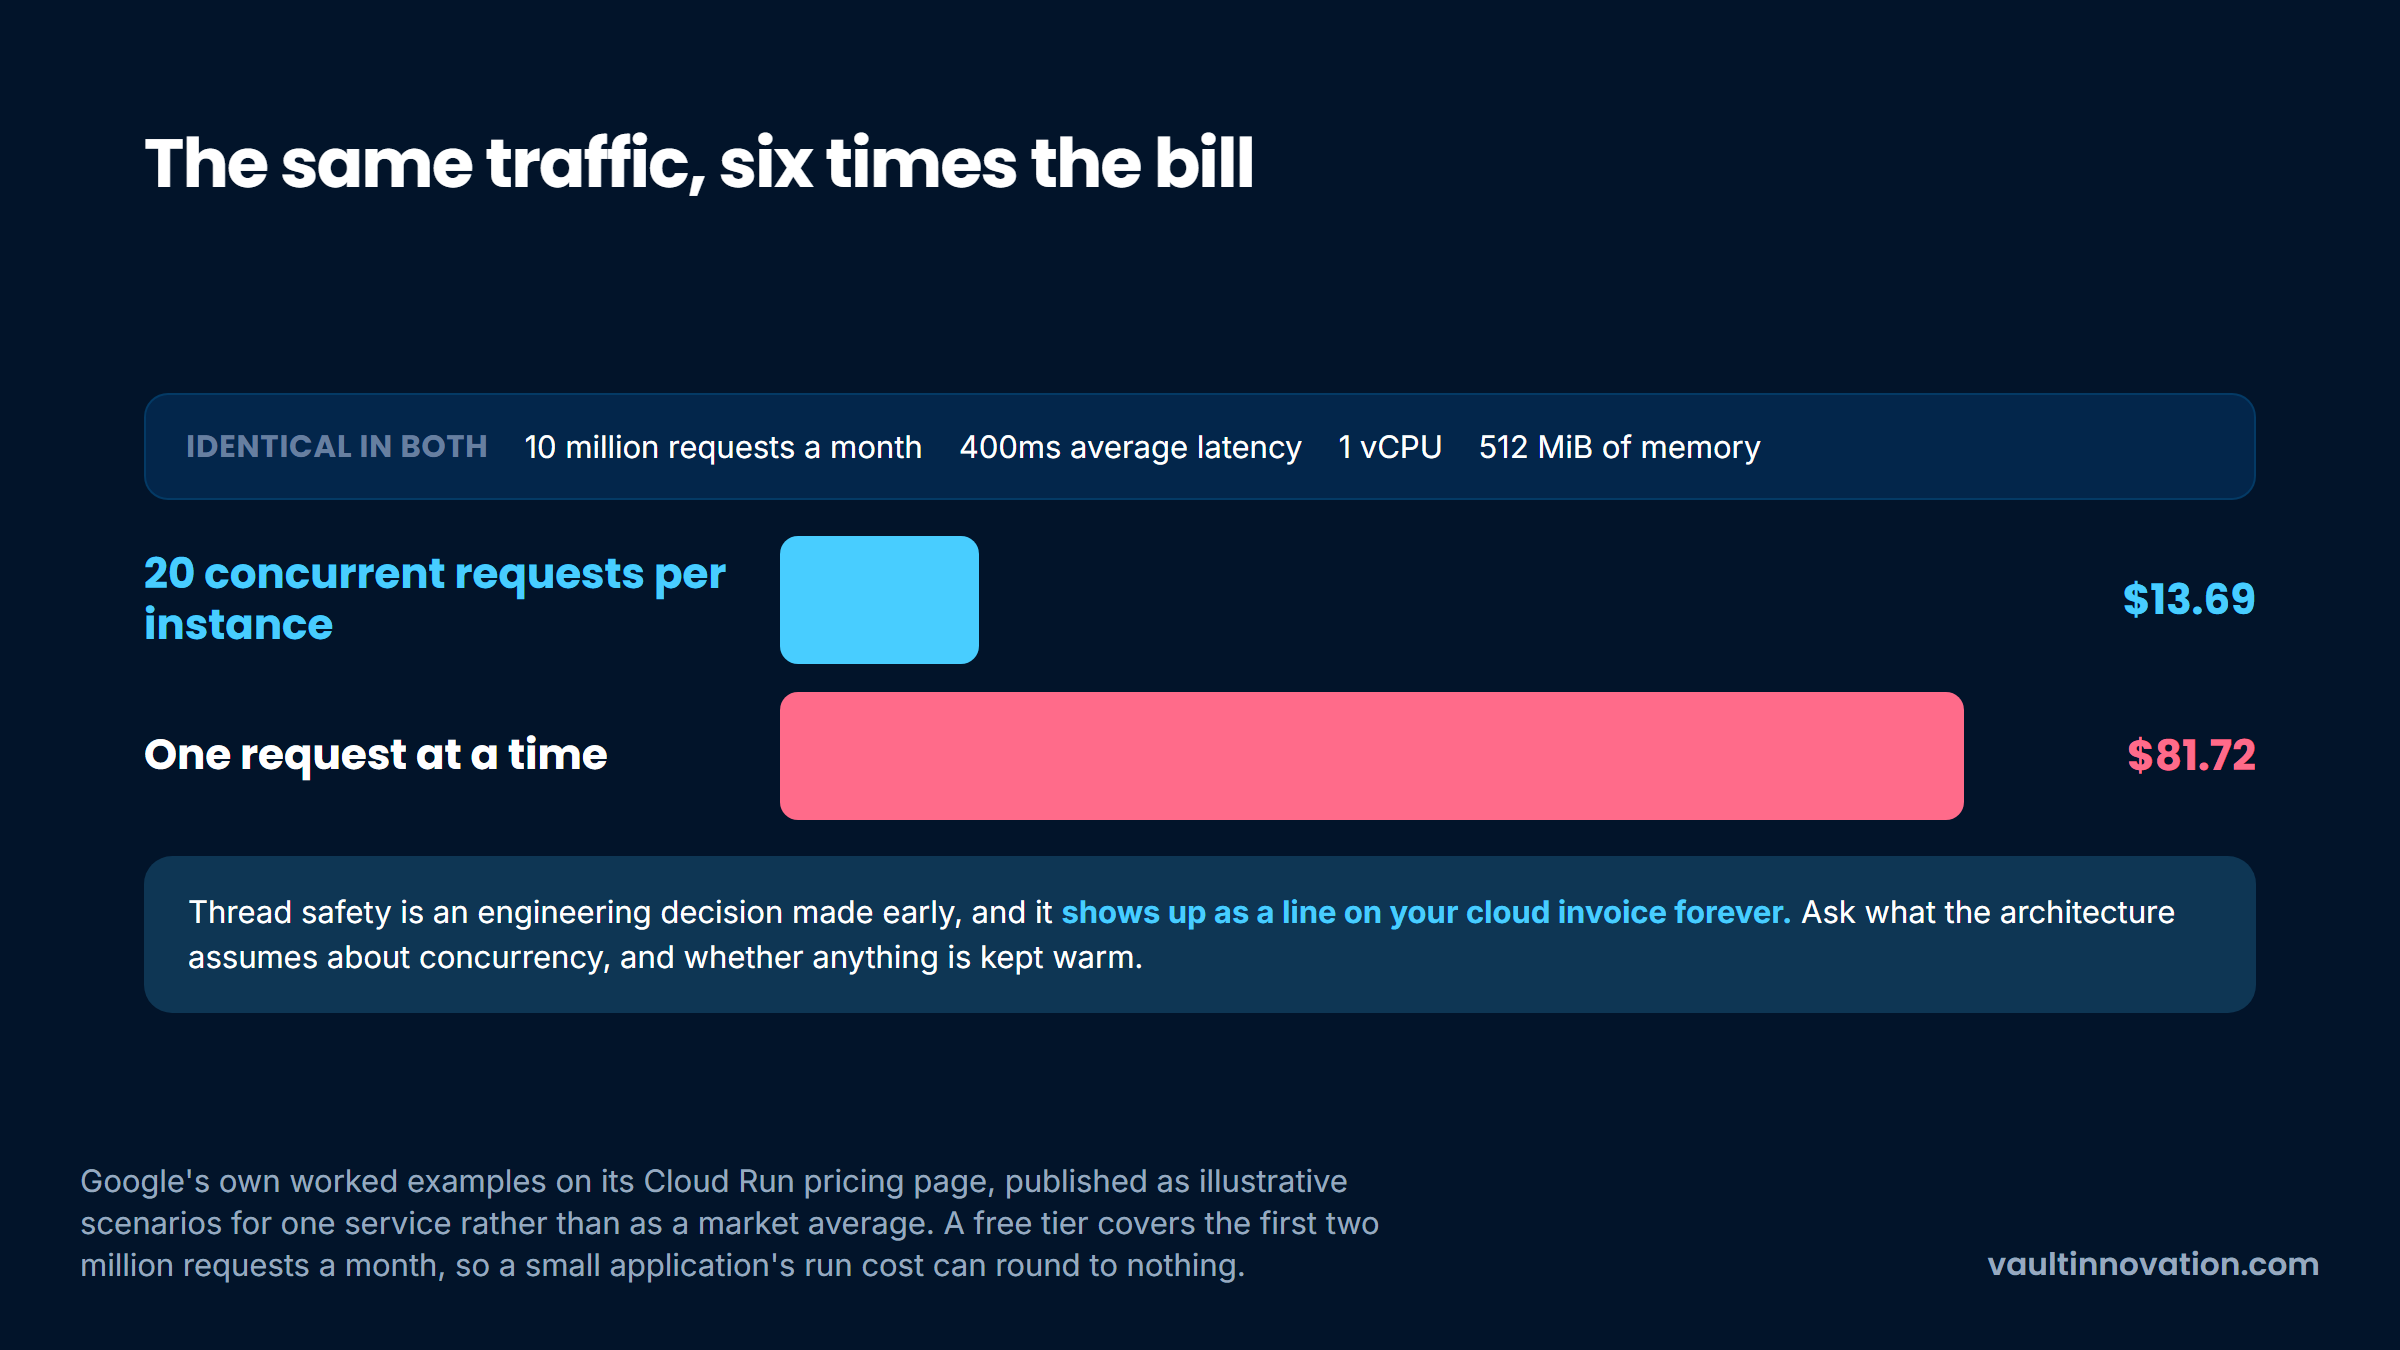
That is roughly six times the bill for the same load, driven by whether the application can handle concurrent requests safely. Thread safety is an engineering decision made early, and it shows up as a line on your cloud invoice forever.
Two further details from the same page shape a realistic estimate. There is a free tier covering the first two million requests, 180,000 vCPU-seconds and 360,000 GiB-seconds per month, which means a small application's run cost can genuinely round to nothing. And minimum instances, the setting that keeps something warm so the first request is fast, bill at a separate idle rate, which is why "always on" has a floor no amount of low traffic removes.
Google publishes those as illustrative scenarios for one service rather than as a market average. What transfers is the shape of the answer: ask what the architecture assumes about concurrency and whether anything is kept warm, because those two answers set the monthly line. The same reasoning runs through our comparison of serverless and Kubernetes for a growing application.
This is the artifact to take into a vendor conversation. The question column is what to ask, the why column names the reason it moves the number, and the source column credits whoever published the supporting figure. Where a row says "our judgment," that is our experience and not a published finding.
| Question to ask | Why it moves the quote | Source |
|---|---|---|
| Which browsers and devices are in the test matrix? | Each combination is another test and fix cycle, and Safari alone is 30.42% of US traffic | Statcounter, US, Sept 2026 |
| How many breakpoints, and are data tables designed at the smallest? | Each breakpoint is a set of layouts, states and error views to design and test | Our judgment; MindInventory prices UI/UX at $7,000 to $10,000 without a count |
| How many roles, and what can each do? | Roles multiply screens, states and test cases, not just login logic | Bacancy prices auth tiers from $3,000 to $60,000 |
| Which third parties, and who owns a failure? | Setup is quoted; monitoring, rate limits and breaking changes usually are not | Bacancy integration ranges; our judgment on ownership |
| What WCAG level, and who tests it? | Four of the six new A/AA criteria in 2.2 hit app UI, and retrofitting costs more than designing | W3C WCAG 2.2 |
| What data exists now, and who grants access? | Validation and access arrangements dominate migration, not the import | Reddit practitioners; our judgment |
| What concurrency, and is anything kept warm? | The same traffic cost $13.69 or $81.72 a month in Google's own examples | Google Cloud Run pricing |
Work through it before you ask for a number, and the ranges you get back will be closer together, because every vendor will be quoting the same product. That alignment is most of what web application development cost estimation actually consists of.
Cheap quotes are not usually dishonest. They are quoting less, and the question worth asking is which of the rows above got left out.
In practice, the budget version drops the browser matrix to whatever the developer uses, designs one breakpoint properly and squeezes the rest, ships two roles instead of five, skips accessibility entirely, and treats migration as an import script. Each of those is a legitimate trade for a first version, and each becomes expensive later in a different way.
The cheapest honest answer is sometimes not to build a web application at all. A content-heavy site with a handful of forms is better served by a platform, and our comparison of CMS options covers where that line sits.
Four of those five sort cleanly into keep and defer.
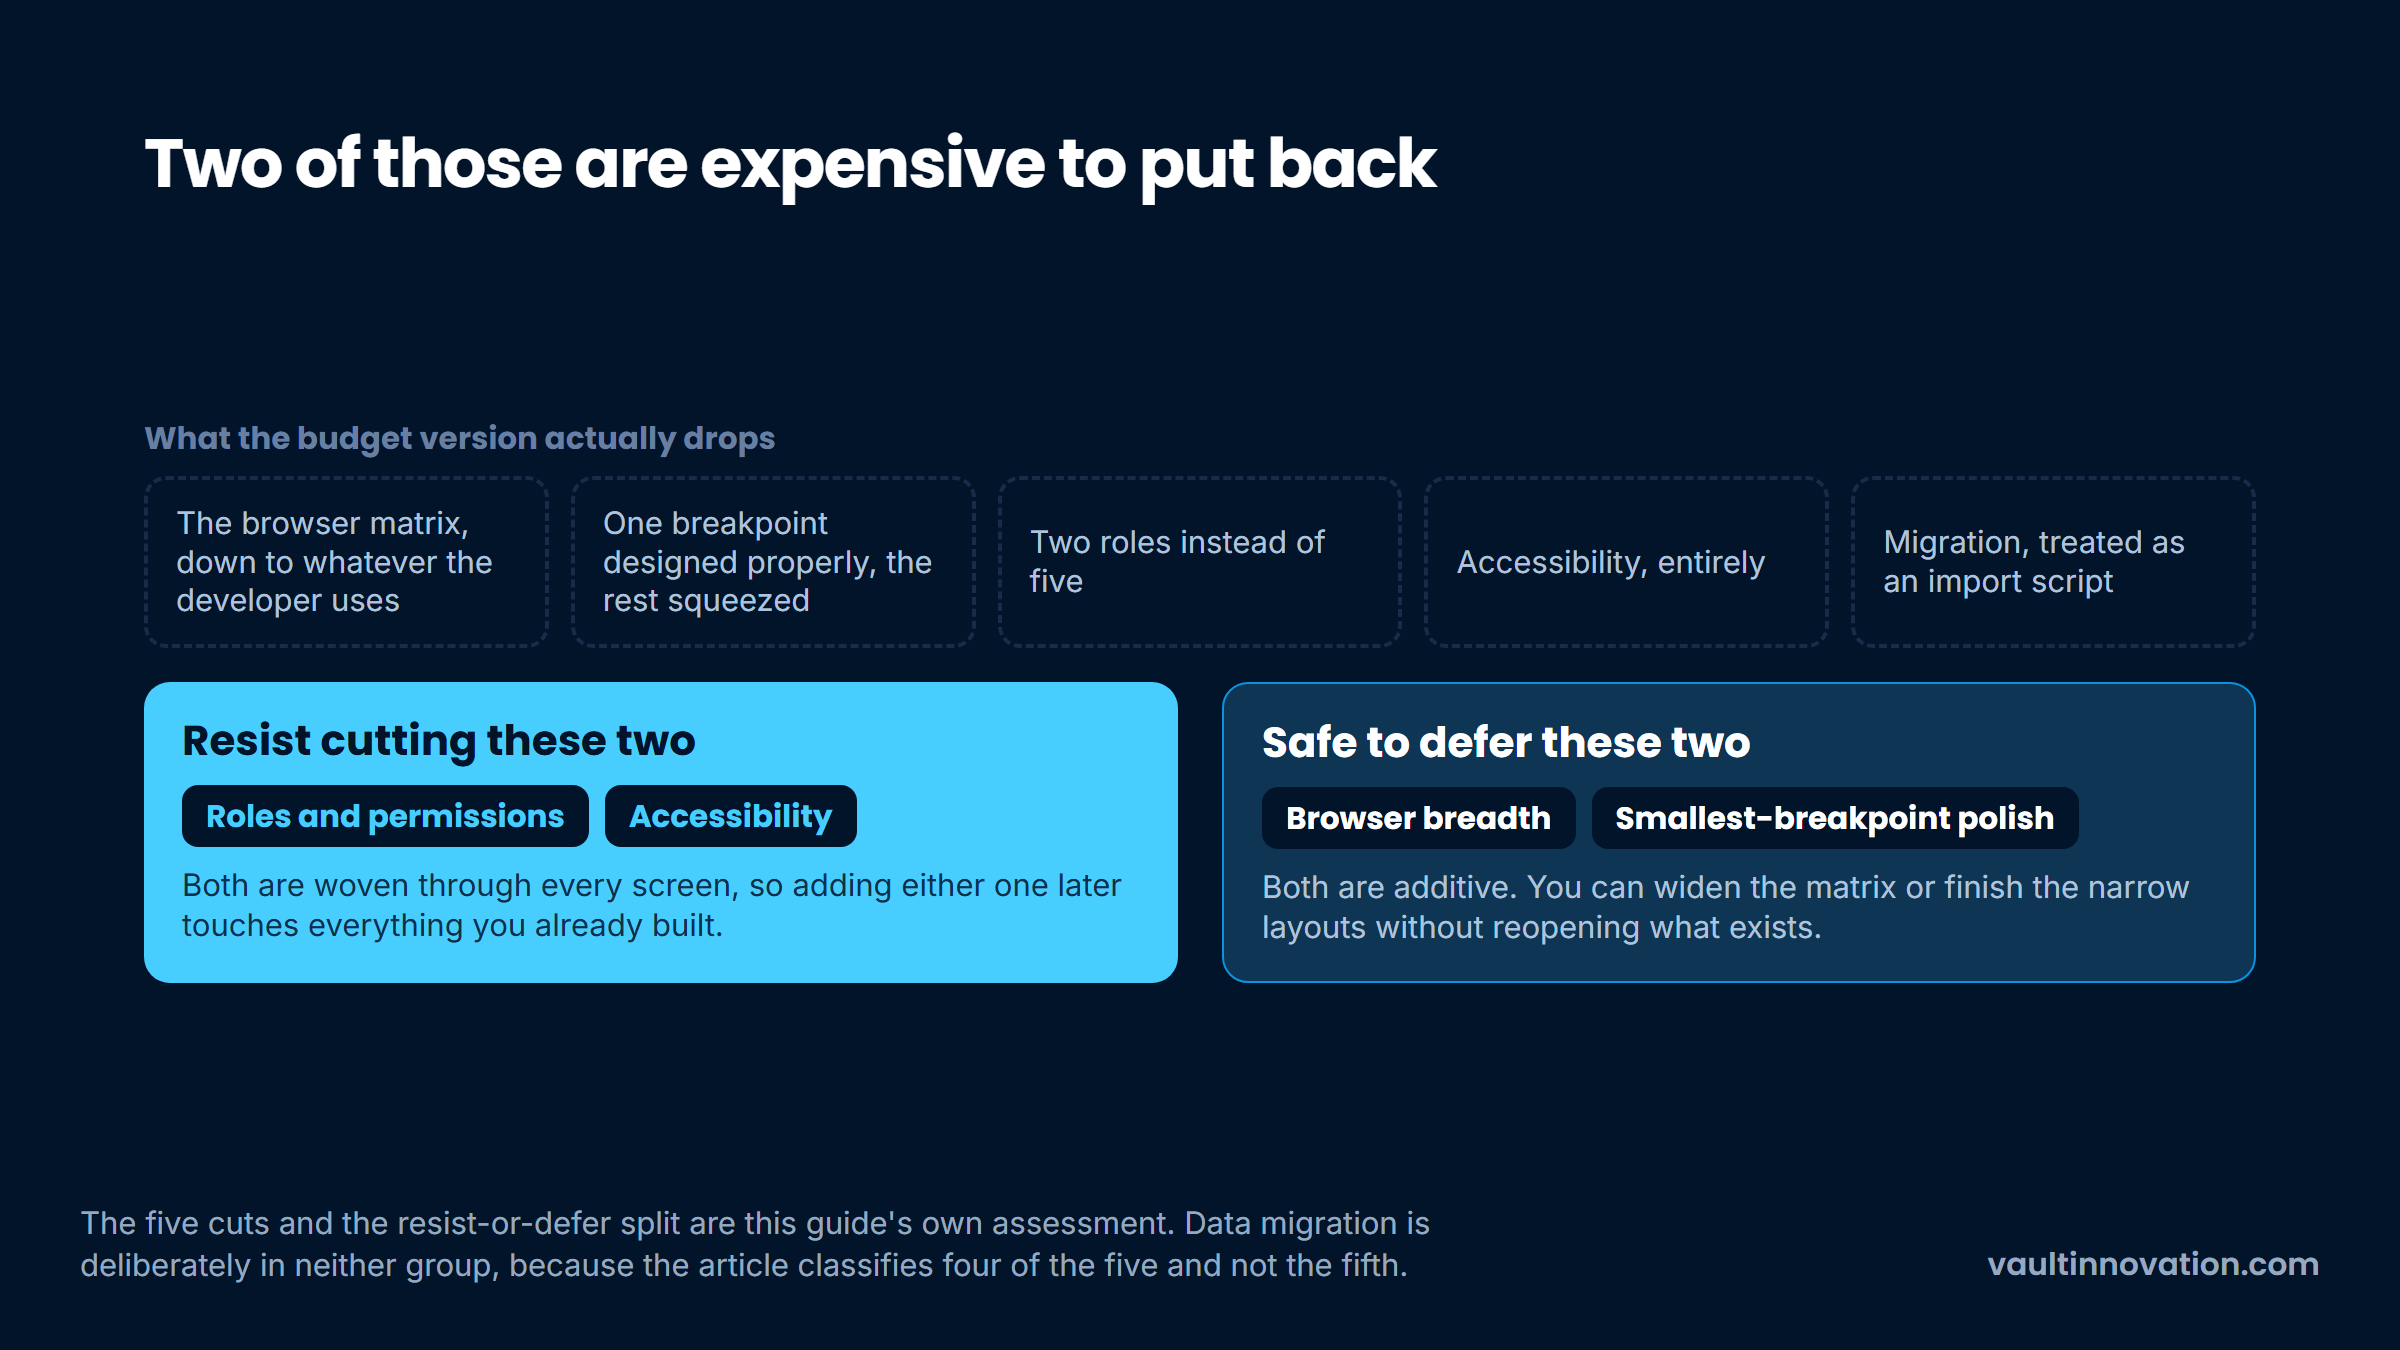
The rows that are genuinely hard to retrofit are roles and accessibility, because both touch every screen. The ones that are safe to defer are breadth of browser support and the polish of the smallest breakpoint, since those are additive. Knowing which is which is most of what separates a useful budget build from one you rewrite.
Fill in the checklist yourself first, even roughly. A vendor quoting against seven answered questions will give you a tighter range than one quoting against a paragraph, and the ones who push back on a question usually do it for a good reason worth hearing.
That is the whole of web application development cost estimation from the buyer's side: decide the scope, then collect numbers against it.
Compare the quotes on scope rather than on the total. Two numbers that differ by double are usually two different products, and the conversation that finds out which is cheaper than the project that discovers it in month four.
If you want a second read on a quote you already have, contact us. We will tell you which of these rows the proposal is silent on, and what we would want answered before signing it.
There is no honest single average, and the published ranges show why: the same "mid-complexity" tier runs from $25,000 to $250,000 across reputable guides, because each one defines the tier differently.
A more useful answer comes from your own answers to the scope questions above. If you want an outside reference point rather than a vendor's band, Clutch publishes an hourly range of $150 to $199 against our own profile. That is Clutch's assessment rather than a rate card of ours, and we publish no price list.
A brochure website and a web application are different products, and conflating them is why so many ranges look absurd. A site presents content; an application has accounts, permissions, state and data that changes.
The cost gap comes from everything that follows from accounts: roles, security, data migration and a run cost that does not stop. If a quote treats your application like a site, that is the first thing to resolve.
A PWA costs what the underlying web application costs, plus the work to make it installable and useful offline. Offline is the expensive half, because it means deciding what happens when two devices change the same record.
One vendor, MindInventory, publishes $25,000 to $50,000 and up for a PWA with push notifications, real-time updates and an API. That is a single publisher's figure, and the offline and sync requirements are what would move it most.
It is, when you know what is being cut. A smaller browser matrix, fewer roles and a single well-designed breakpoint are reasonable trades for a first release.
Accessibility and the permission model are the two to resist cutting, because both are woven through every screen and are the most expensive things on the list to add afterward.
Usually because the brief left the scope questions open and each agency filled them in differently. On one public thread two developers priced the same described job at roughly $4,000 to $7,000 and about $10,000, with the gap sitting entirely in how much data validation each assumed.
Answering the checklist closes most of that gap. What remains is a genuine difference in approach, and that is the part worth discussing.
A proposal is easiest to judge on what it does not mention. Contact us and we will go through yours against the checklist above, and tell you which silences are normal and which ones would worry us.